Saturday, March 7, 2020

Position measurement- Encoder


Shaft Encoders

Any transducer that generates a coded digital signal of a measured quantity is known as an encoder. Shaft encoders are used to measure angular displacements and angular velocities. High resolution, high accuracy, and digital output are some of the relative advantages of shaft encoders.

Resolution: Depends on the word size of the encoder output and the number of pulses generated per revolution of the encoder.

Accuracy:  Due to noise immunity and reliability of digital signals.

Encoder Types

Shaft encoders can be classified into two categories depending on the nature and the method of interpretation of the transducer output: (1) incremental encoders and (2) absolute encoders.

Incremental Encoder

The output of an incremental encoder is a pulse train signal, which is generated when the transducer disk rotates. The number of pulses and the number of pulse per unit time gives the measurement of angular displacement and angular velocity of the device on which the encoder disk is mounted. With an incremental encoder, displacement is obtained with respect to some reference point or marker. That is, incremental encoder giver relative position of a body wrt its initial position. The reference point can be the home position of the moving component (say, determined by a limit switch) or a reference point on the encoder disk, as indicated by a reference pulse (index pulse) generated at that location on the disk. The index pulse count determines the number of full revolutions.

Absolute Encoder

An absolute encoder has many pulse tracks on its transducer disk. When the disk of an absolute encoder rotates, several pulse trains are generated simultaneously. The number of pulse train is equal to the number of tracks on the disk. At a given instant, the magnitude of each pulse signal will be either ‘1’ (HIGH) or ‘0’ (LOW) depending on opaque and transparent segment of disk.. Hence, the set of pulse trains gives an encoded binary number at any instant. This encoded binary data gives the absolute position of the body on which the encoder is mounted. The pulse voltage can be made compatible with some digital interface logic (e.g TTL). Consequently, the direct digital readout of an angular position is possible with an absolute encoder. Absolute encoders are commonly used to measure fractions of a revolution. However, complete revolutions can be measured using an additional track, which generates an index pulse, as in the case of an incremental encoder. The same signal generation (and pick-off) mechanism may be used in both types (incremental and absolute) of transducers.

Encoder Technologies

Four techniques of transducer signal generation may be identified for shaft encoders:

1.      Optical method- we will discuss only this method in the post.

2.      Sliding contact (electrical conducting) method

3.      Magnetic saturation (reluctance) method

4.      Proximity sensor method

By far, the optical encoder is most common and cost-effective. The other three methods may be used in special circumstances, where the optical method may not be suitable (e.g., under extreme tem peratures or in the presence of dust, smoke, etc.). For a given type of encoder (incremental or absolute), the method of signal interpretation is identical for all four types of signal generation listed previously. Now we briefly describe the principle of signal generation for all four techniques and consider only the optical encoder in the context of signal interpretation and processing.

Optical Encoder

The optical encoder uses an opaque disk (coded disk) that has one or more circular tracks, with some arrangement of identical transparent windows (slits) in each track. A parallel beam of light (e.g., from a set of light-emitting diodes or LEDs) is projected to all tracks from one side of the disk. The transmitted light is picked off using a series of photosensors on the other side of the disk, which typically has one sensor for each track. This arrangement is shown in Figure a, which indicates just one track and one pick-off sensor. The light sensor could be a silicon photodiode or a phototransistor. Since the light from the source is interrupted by the opaque regions of the track, the output signal from the photosensor is a series of voltage pulses. This signal can be interpreted through edge detection or level detection to obtain the increments in the angular position and also the angular velocity of the disk.

The sensor element of such a measuring device is the encoder disk, which is coupled to the rotating object directly or through a gear mechanism. The transducer stage is the conversion of disk motion (analog) into the pulse signals, which can be coded into a digital word.

If the direction of rotation is not important, an incremental encoder disk requires only one primary track that has equally spaced and identical pick-off regions. A reference track that has just one window may be used to generate the index pulse, to initiate pulse counting for angular position measurement and to detect complete revolutions.

Note: A transparent disk with a track of opaque spots will work equally well as the encoder disk of an optical encoder. In either form, the track has a 50% duty cycle (i.e., the length of the transparent region is equal to the length of the opaque region).

Direction of Rotation

An incremental encoder generally have a second track placed at quarter-pitch separation from the first track pattern (pitch = center-to-center distance between adjacent windows) to generate a quadrature signal, which will indicate the direction of rotation.

An incremental encoder typically has the following five pinouts:

1. Ground

2. Index Channel

3. A Channel

4. +5V dc power

5. B Channel

Pins for Channel A and Channel B give the quadrature signals shown in Figure a and b, and the Index pin gives the reference pulse signal shown in Figure c. Figure 2a shows the sensor outputs (v1 and v2) when the disk rotates in the clockwise (cw) direction; and Figure 2b shows the outputs when the disk rotates in the counterclockwise (ccw) direction. Several methods can be used to determine the direction of rotation using these two quadrature signals. For example,

1.      By phase angle between the two signals

2.      By clock counts to two adjacent rising edges of the two signals

3.      By checking for rising or falling edge of one signal when the other is at high

4.       For a high-to-low transition of one signal check the next transition of the other signal
Pulsed signal output of incremental encoder. (a) CW rotation; (b) CCW rotation; (c) Index pulse
Method 1: It is clear from Figure 2a and b that in the CW rotation, v1 lags v2 by a quarter of a cycle (i.e., a phase lag of 90°) and in the CCW rotation, v1 leads v2 by a quarter of a cycle. Hence, the direction of rotation may be obtained by determining the phase difference of the two output signals, using phase detecting circuitry.
Method 2: A rising edge of a pulse can be determined by comparing successive signal levels at fixed time periods (can be done in both hardware and software). Rising-edge time can be measured using pulse counts of a high-frequency clock. Suppose that the counting (timing) begins when the v1 signal begins to rise (i.e., when a rising edge is detected). Let n1 = number of clock cycles (time) up to the time when v2 begins to rise; and n2 = number of clock cycles up to the time when v1 begins to rise again. Ten, the following logic applies:
If n1 > n2 – n1àCW rotation
If n1 < n2 – n1àCCW rotation
Method 3: In this case, firstly high level logic of v2 is detected and then check if v1 is at rising or falling edge.
If v1 is at rising edge when v2 is at logic high à CW rotation
If v1 is at falling edge when v2 is at logic high à CCW rotation
Method 4: Detect a high to low transition in signal v1.
If the next transition in signal v2 is Low to High à CW rotation
If the next transition in signal v2 is High to Low à CCW rotation

Sunday, March 1, 2020

Strain Gauge


Introduction

A strain gauge is a resistive sensor whose resistance is a function of applied strain. Under the effect of external force, the length and cross-section area of a conductor changes. Due to this resistance change takes place. The resistivity of the conductor also changes and this property is known as the piezoresistive effect and is expressed through the gauge factor Gf of the conductor. The value of Guage factor is ≈ 2 for most conductors. For Platinum its value is 6. For silicon its value is upto 150.

Early strain gauges were fine metal filaments. Modern strain gauges are manufactured primarily as metallic foil using the constantan or Semiconductor elements (e.g., silicon with trace impurity boron). They are manufactured by first forming a thin film (foil) of metal or a single crystal of Semiconductor material and then cutting it into a suitable grid pattern. This process is much more economical and is more precise than making strain gauges with metal filaments.

The strain-gauge element is formed on a backing film of electrically insulated material of polymide plastic. This element is cemented or bonded using epoxy, onto the member whose strain is to be measured. strain from the object must be reliably coupled to the gauge wire, whereas the wire must be electrically isolated from the object. The coefficient of thermal expansion of the backing should be matched to that of the wire. Alternatively, a thin film of insulating ceramic substrate is melted onto the measurement surface, on which the strain gauge is mounted directly. The direction of sensitivity is the major direction of elongation of the strain-gauge element. To measure strains in more than one direction, multiple strain gauges (e.g., various rosette configurations) are available as single units. These units have more than one direction of sensitivity.
Gage resistance values range from 30 to 3000 ohms, with 350 ohms being the most
commonly used.
Theory

The change of electrical resistance of a material when mechanically deformed is the property used in resistance-type strain gauges. The resistance R of a conductor of length and area of cross-section A is given by

Under the influence of tensile force F, the length of the conductor increases by dL and diameter decreases by dD and the resistance changes by dR.

 
Differentiating both sides,

where
If the change in the value of resistivity of a material under strain is neglected, the Gauge factor can be written as
The Poisson’s ration for all metals is between 0 to 0.5. This gives a gauge factor of about 2.

Strain gauge Applications


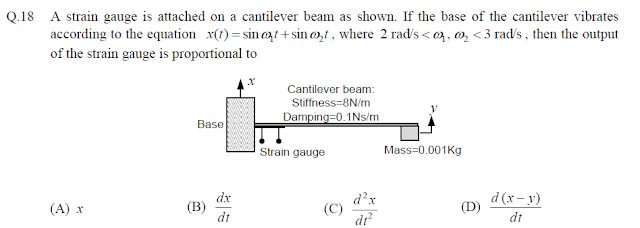
Many variables—including displacement, acceleration, pressure, temperature, liquid level, stress, force, and torque—can be determined using strain measurements. Some variables (e.g., stress, force, and torque) can be determined by measuring the strain of the dynamic object itself at suitable locations. In other situations, an auxiliary front-end device may be required to convert the measurand into a proportional strain. For instance, pressure or displacement may be measured by converting them to a measurable strain using a diaphragm, bellows, or a bending element. Acceleration may be measured by first converting it into an inertia force of a suitable mass (seismic mass) element, then subjecting a cantilever (strain member) to that inertia force, and finally, measuring the strain at a high-sensitivity location of the cantilever element. Temperature may be measured by measuring the thermal expansion or deformation in a bimetallic element.


Strain Gauge measurement
The preferred circuit for use in strain-gauge measurements is the Wheatstone bridge. One or more of the four resistors R1, R2, R3, and R4 in the bridge may represent strain gauges. The output relationship for the Wheatstone bridge circuit is given by
When this output voltage is zero, the bridge is balanced. It follows from Equation above that for a balanced bridge,

Equation above is valid for any value of the load resistance RL, because when the bridge is balanced, current i through the load become zero.
Bridge Sensitivity
Strain-gauge measurements are calibrated with respect to a balanced bridge. When a strain gauge in
the bridge deforms, the balance is upset. If one of the arms of the bridge has a variable resistor, it can be
adjusted to restore the balance. The amount of this adjustment measures the amount by which the resistance of the strain gauge has changed, thereby measuring the applied strain. This is known as the null-balance method of strain measurement. This method is inherently slow because of the time required to balance the bridge each time a reading is taken.
A more common method, which is particularly suitable for making dynamic readings from a strain-gauge bridge, is to measure the output voltage resulting from the imbalance caused by the deformation of an active strain gauge in the bridge. To determine the calibration constant of a strain-gauge bridge, the sensitivity of the bridge output to changes in the four resistors in the bridge should be known. For small changes in resistance, this may be determined as dVo/Vin.
Tee Rosette

Rectangular Rosette

Figure below shows a rectangular rosette which is used when orientation of principal axes is unknown. The gauge elements are mounted in 0°, 45° and 90° orientation. Typical setup is for each gauge element to become an active arm in separate Wheatstone bridge circuits (i.e. a Wheatstone bridge for each gauge element of the rosette).

Strain gauge installation
Proper strain gauge installation is necessary to obtain accurate
experimental stress results. Skilled technicians usually install strain gauges after attending a
strain gauge school or training course. The decision on locations of the desired stress
measurements is usually made by the test sponsor or mechanical design team of the test item.
The instrumentation engineer must then ensure the following items are addressed. Failure to
proceed in this fashion will result in poor gauge adhesion, faulty data, and engineer frustration.
a. The supplies should be on hand for the technicians to apply the gauges when the time comes.
b. The type of gauge, the material to which the gauge is to be mounted, and the environment in which the gauge will be exposed.
c. Are the principal axes known (many times they are not)?
d. How long do these gauges need to be used?
e. Will the gauges be submersed in a liquid?
f. Will the gauges be exposed to temperature extremes?
g. How long will the lead wires need to be?
h. Can the bridge completion resistors be co-located at the site of the strain gauge?

Once all of the supplies are on hand and the desired locations of the gauges known, the installation process can begin. The following steps should be followed.
a. Surface preparation. The surfaces to which the gauges are to be applied must be free of paint, oil, grease, etc. The surface preparation usually involves paint stripping, sanding, and degreasing.
b. Install gauge or rosette. The gauge (or rosette) is applied to the surface with an adhesive. Adhesives exist for a variety of environments and desired lifespan. Cure times vary from a few hours to several days. Cure temperatures can vary from room temperature to several hundred degrees Centigrade. During the curing process, evenly distributed pressure is usually required on the applied gauge(s). 
c. Install bridge. The bridge completion resistor assemblies and small wire terminals or solder tabs may be bonded near the gauge. Small gauge wire is typically used to connect the gauge to the bridge completion packs and to the wire solder tabs. The larger gauge lead wires are then soldered to these tabs and completion networks (not directly to the gauge itself).
d. Epoxies and sealants. Finally, depending on the test environment, several additional coatings of specialized epoxies and sealants may be needed to protect the gauge(s), bridge completion packs, and/or wire tabs.
e. Patience and skill. Skipping steps is not advisable.

GATE QUESTIONS
GATE-2007
GATE-2008


GATE-2009

GATE-2010


GATE-2012

GATE-2014

Semiconductor strain gages typically have much higher gage factors than those of metallic strain gages, primarily due to :
(A) higher temperature sensitivity
(B) higher Poisson’s ratio
(C) higher piezoresitive coefficient
(D) higher magnetostrictive coefficient

GATE-2015
A p-type semiconductor strain gauge has a nominal resistance of 1000 Ω and a gauge factor of +200 at 25 °C. The resistance of the strain gauge in ohms when subjected to a strain of +10−4 m/m at the same temperature is __________ Ω.

GATE-2018
A 1000 Ohm strain gage (Rg) has a gage factor of 2.5. It is connected in the bridge as shown in
figure. The strain gage is subjected with a positive strain of 400 um/m. The output Vo (in

mV) of the bridge is (up to two decimal places) _____.

Friday, February 28, 2020

LVDT- Linear Variable Differential transformer

LVDT- Linear Variable Differential transformer


Position and displacement may be sensed by methods of electromagnetic induction. The most commonly used inductive transducer to convert linear motion into electrical signals is the Linear Variable Differential Transformer or LVDT as they are commonly known.
An LVDT consists of one primary coil and two secondary coils. The primary coil carries ac excitation (Vref) that induces a steady ac voltage in the secondary coils. The induced amplitude depends on flux coupling between the coils.
There are two techniques for changing the coupling.
  • One is the movement of a core made of ferromagnetic material within the flux path. This changes the reluctance of the path, which, in turn, alters the coupling between the coils. This is the basis for the operation of a LVDT (linear variable differential transformer), a RVDT (rotary variable differential transformer).
  • The other method is to physically move one coil with respect to another.
Generally, the core is made of high permeability, nickel iron which is hydrogen annealed. It gives low harmonics, low null voltage.


The ac excitation in the primary coil produces an alternating magnetic field which induces an alternating current in the secondary coils. The secondary coils are connected in series opposition. Hence the polarity of voltage induces is opposite in the two secondary coils. When the core is positioned in the magnetic center of the transformer, the secondary output signals cancel and there is no output voltage. This is known as “null position”.
Moving the core away from the central position unbalances the induced magnetic flux ratio between the secondaries, developing an output. As the core moves, reluctance of the flux path changes. Hence, the degree of flux coupling depends on the axial position of the core. At a steady state, the amplitude of the induced voltage is proportional to the core displacement. Consequently, voltage may be used as a measure of a displacement. The LVDT provides the direction as well as magnitude of the displacement. The direction is determined by the phase angle between the primary (reference) voltage and the secondary voltage. Excitation voltage is generated by a stable oscillator.
The LVDT is considered a passive transducer because the displacement of the core, which is being measured, itself provides energy for changing the induced voltage in the secondary coil. Even though an external power supply is used to energize the primary coil, which in turn induces a steady voltage at the carrier frequency in the secondary coil, which is not relevant in the definition of a passive transducer.
Note: Because of opposed secondary windings, the LVDT provides the direction as well as the magnitude of displacement. When the output signal is demodulated, its sign gives the direction. If the output signal is not demodulated, the direction is determined by the phase angle between the primary (reference) voltage and the secondary (output) voltage, which includes the carrier signal.
For an LVDT to measure transient motions accurately, the frequency of the reference voltage (the carrier frequency) has to be at least 10 times larger than the largest significant (useful) frequency component in the measured motion, and typically can be as high as 20 kHz. For quasi-dynamic displacements and slow transients of the order of a few hertz, a standard ac supply (at 50/60 Hz line frequency) is adequate. The performance (particularly sensitivity and accuracy) is known to improve with the excitation frequency, however. Since the amplitude of the output signal is proportional to the amplitude of the primary signal, the reference voltage should be regulated to get accurate results. In particular, the power source should have a low output impedance.

Ideally the output at the null position should be equal to zero. However in practice there exists a small voltage at the null position. This may be due to presence of harmonics in the input supply  voltage, stray magnetic fields, temperature effect among other reasons.


Calibration and Compensation

An LVDT may be calibrated in millimeter per volt (mm/V), in its linear range. In addition, and a displacement offset (mm) may be provided. This typically represents the least squares fit of a set of calibration data. Since ambient temperature and other environmental conditions will affect the LVDT output, in addition to the primary and secondary coils, a reference coil may be available for compensation of the LVDT output.


Advantages of the LVDT include the following:


1.       It is essentially a non-contacting device with no frictional resistance. Lightweight core will result in very small resistive forces.

2.       Hysteresis (both magnetic hysteresis and mechanical backlash) is negligible.

3.       It has low output impedance, typically in the order of 100 Ω.

4.       It provides directional measurements (positive/negative).

5.       It is available in miniature sizes as well (e.g., length of 1 or 2 mm, displacement measurements of a fraction of a millimeter, and maximum travel or stroke of 1 mm).

6.       It has a simple and robust construction (inexpensive and durable)

7.       It has fine resolutions (theoretically, infinitesimal resolution; practically, much better than a coil potentiometer)


Disadvantages


1.      They are sensitive to stray magnetic field.

2.      Output signal need amplification due to its small magnitude.

3.      Measurement is affected by vibrations.

4.      Affected by temperature variation.

Monday, February 24, 2020

Piezo electric effect


Electrical charges are produced on the opposite surfaces of some crystals when subjected to force or torsion. The electrical charge produced is proportional to the effective force. By application of force, dimension of the crystal changes causing a displacement of charge. Piezoelectric effect is reversible, i.e. if a varying potential is applied to the crystal, it will change the dimension of the crystal along a certain axis.

It must be remembered that a piezoelectric crystal can convert a changing force into a changing electrical signal, whereas a steady-state force produces no electrical response.

Piezo-electric crystals are available in two forms- natural and man-made. Quartz and ceramic are examples of naturally available piezo-electric crystals whereas Rochelle salts, Lithium sulphate, Ammonium dihydrogen phosphate etc are examples of man-made crystals. Quartz is considered as one of the most stable piezo-electric crystal and is known for its ability
to perform accurate measurement for time and frequency.
Its output is independent of temperature variation. They have low voltage sensitivity but high charge sensitivity.

Description of operation

The piezoelectric effect causes a realignment and accumulation of positively and negatively charged electrical particles, or ions, at the opposed surfaces of a crystal lattice, when that lattice undergoes stress. The number of ions that accumulate is directly proportional to the amplitude of the imposed stress or force.

PE transducers use a spring-mass system to generate a force proportional to the amplitude and frequency of the input quantity. The stress imposed upon the piezoelectric material is the direct result of a physical input such as acceleration, force, or pressure. To accomplish this, a mass is attached to the crystal, which, when accelerated, causes force to act upon the crystal. The mass, also known as a seismic mass, creates a force directly proportional to acceleration according to Newton’s law of motion, F=ma. Thin metallic electrodes collect the accumulated ions. Small lead wires interconnect the electrodes to an electrical connector or feed-through, to which cabling is attached. An advantage of PE materials is that they are self-generating and require no external power source.

A piezo-elecric crystal can be considered as charge generator and a capacitor. External force generates a charge and this charge appears as voltage across the electrodes.

The voltage V=Q/C . The voltage polarity depends on the direction of applied force.

The amount and polarity of charge produced is proportional to the magnitude and direction of force.

Charge Q = kq x F Coulomb,                                                  (1)

where kq is the charge sensitivity of the crystal; C/N and F is applied force; N

From Hooke’s Law, the Young’s modulus Y of the crystal is given as
Where A = area of crystal; t = thickness of crystal; Y = Young’s modulus; A = area of crystal;


From above equations,

The voltage output Vo is given as 

Where C is the capacitance between the electrodes;
From above equations, 
Where                          P = F/A= stress or pressure, N/m2
Electrical analysis of Piezo-electric crystals
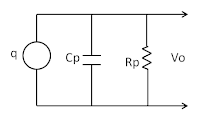
Piezo-electric crystal can be considered a charge generator. The amount of charge is q= kq x F.
The charge appears across capacitance Cp of the crystal. Rp is the leakage resistance of the crystal. The equivalent circuit with voltage source id shown above. The voltage
V=q/Cp = kq x F/Cp
If a load is connected at the output, the load capacitance CL and resistance RL will make the loaded circuit as below.
We can consider Rp as very large (open).
The equivalent impedance of load is
The total impedance is

Displacement measurement using Piezo-crystal


At steady state when ω=0, M=0. Hence piezo-crystals are not suitable for static measurements.

Uses

They are used in numerous applications such as environmental stress screening, vibration control, active vibration reduction, flight testing, wind tunnel testing, structural testing, modal analysis, seismic vibration, package testing, shock, motion and attitude detection and stabilization, ride quality response and simulation, acoustic testing and noise, harshness and vibration testing. Fast response, ruggedness, high stiffness, extended range, and the ability to also measure quasi-static forces are standard features associated with PE sensors.

Gate Questions
GATE-2008


GATE-2012

 GATE-2013
 GATE-2014

 GATE-2018


Modbus and OPC comparison Table

  Modbus vs OPC Comparison between Modbus and OPC Feature Modbus OPC (OLE f...