Monday, February 24, 2020

Piezo electric effect


Electrical charges are produced on the opposite surfaces of some crystals when subjected to force or torsion. The electrical charge produced is proportional to the effective force. By application of force, dimension of the crystal changes causing a displacement of charge. Piezoelectric effect is reversible, i.e. if a varying potential is applied to the crystal, it will change the dimension of the crystal along a certain axis.

It must be remembered that a piezoelectric crystal can convert a changing force into a changing electrical signal, whereas a steady-state force produces no electrical response.

Piezo-electric crystals are available in two forms- natural and man-made. Quartz and ceramic are examples of naturally available piezo-electric crystals whereas Rochelle salts, Lithium sulphate, Ammonium dihydrogen phosphate etc are examples of man-made crystals. Quartz is considered as one of the most stable piezo-electric crystal and is known for its ability
to perform accurate measurement for time and frequency.
Its output is independent of temperature variation. They have low voltage sensitivity but high charge sensitivity.

Description of operation

The piezoelectric effect causes a realignment and accumulation of positively and negatively charged electrical particles, or ions, at the opposed surfaces of a crystal lattice, when that lattice undergoes stress. The number of ions that accumulate is directly proportional to the amplitude of the imposed stress or force.

PE transducers use a spring-mass system to generate a force proportional to the amplitude and frequency of the input quantity. The stress imposed upon the piezoelectric material is the direct result of a physical input such as acceleration, force, or pressure. To accomplish this, a mass is attached to the crystal, which, when accelerated, causes force to act upon the crystal. The mass, also known as a seismic mass, creates a force directly proportional to acceleration according to Newton’s law of motion, F=ma. Thin metallic electrodes collect the accumulated ions. Small lead wires interconnect the electrodes to an electrical connector or feed-through, to which cabling is attached. An advantage of PE materials is that they are self-generating and require no external power source.

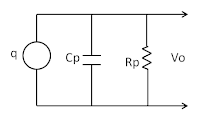
A piezo-elecric crystal can be considered as charge generator and a capacitor. External force generates a charge and this charge appears as voltage across the electrodes.

The voltage V=Q/C . The voltage polarity depends on the direction of applied force.

The amount and polarity of charge produced is proportional to the magnitude and direction of force.

Charge Q = kq x F Coulomb,                                                  (1)

where kq is the charge sensitivity of the crystal; C/N and F is applied force; N

From Hooke’s Law, the Young’s modulus Y of the crystal is given as
Where A = area of crystal; t = thickness of crystal; Y = Young’s modulus; A = area of crystal;


From above equations,

The voltage output Vo is given as 

Where C is the capacitance between the electrodes;
From above equations, 
Where                          P = F/A= stress or pressure, N/m2
Electrical analysis of Piezo-electric crystals
Piezo-electric crystal can be considered a charge generator. The amount of charge is q= kq x F.
The charge appears across capacitance Cp of the crystal. Rp is the leakage resistance of the crystal. The equivalent circuit with voltage source id shown above. The voltage
V=q/Cp = kq x F/Cp
If a load is connected at the output, the load capacitance CL and resistance RL will make the loaded circuit as below.
We can consider Rp as very large (open).
The equivalent impedance of load is
The total impedance is

Displacement measurement using Piezo-crystal


At steady state when ω=0, M=0. Hence piezo-crystals are not suitable for static measurements.

Uses

They are used in numerous applications such as environmental stress screening, vibration control, active vibration reduction, flight testing, wind tunnel testing, structural testing, modal analysis, seismic vibration, package testing, shock, motion and attitude detection and stabilization, ride quality response and simulation, acoustic testing and noise, harshness and vibration testing. Fast response, ruggedness, high stiffness, extended range, and the ability to also measure quasi-static forces are standard features associated with PE sensors.

Gate Questions
GATE-2008


GATE-2012

 GATE-2013
 GATE-2014

 GATE-2018


Sunday, February 16, 2020

Ultrasonic Flowmeters


Working Principle

The working principle of the ultrasonic flow meter is based on the transmission
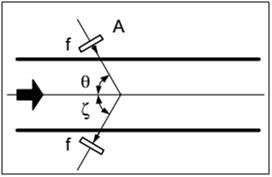
of ultrasonic waves in a medium. One or more ultrasonic transmitting-receiving pairs are mounted in or on the pipe, diametrically opposite to each other. The first pair is placed slightly more downstream than the second pair, so they make a certain angle with the pipe longitudinally.

The main idea behind the principle is the detection of frequency or phase shift caused by flowing medium. The effective velocity of sound in a moving medium is equal to the velocity of sound relative to the medium plus the velocity of the medium with respect to the source of the sound. Thus, a sound wave propagating upstream will have a smaller effective velocity, and the sound propagating downstream will have a higher effective velocity. Because the difference between the two velocities is exactly twice the velocity of the medium, measuring the upstream–downstream velocity difference allows us to determine the velocity of the flow.

Types of Ultrasonic Flowmeters

There are various types of ultrasonic flowmeters in use for discharge measurement:

(1)   Transit time


This type of ultrasonic flowmeter makes use of the difference in the time for a sonic pulse to travel a fixed distance, first against the flow and then in the direction of flow. Transmit time flowmeters are sensitive to suspended solids or air bubbles in the fluid.


Figure above shows two ultrasonic generators positioned on opposite sides of a pipe of flow. Piezoelectric crystals are usually employed for that purpose. Each crystal can be used for either the generation of the ultrasonic waves or for receiving the ultrasonic waves. Two crystals are separated by distance D and positioned at angle ‘ф’ with respect to flow. The transit time of sound between two transducers A and B can be found through the average fluid velocity v:
where c is the velocity of sound in the fluid. The velocity v is the flow velocity averaged along the path of the ultrasound. By taking the difference between the downstream and upstream velocities, we find


(2)   Doppler frequency shift
This type is more popular and less expensive, but is not considered as accurate as the transit time flowmeter. It makes use of the Doppler frequency shift caused by sound reflected or scattered from suspensions in the flow path and is therefore more complementary than competitive to transit time flowmeters.
This technique is more popular in so-called “clamp-on” meters. The Doppler effect occurs with sound as well as electromagnetic waves. When a source or receiver moves in a wave medium, the frequency at the receiver will differ from the frequency at the transmitter. The frequency increases with a movement towards the source and it decreases with a movement away from the source. This is caused by the constant velocity of the wave in the medium. If all velocities in the same direction are counted positively, we can describe the Doppler effect as follows:
Where
fo: observed frequency for movement
fs: frequency of the source in rest
c: transmission velocity in the medium
vo: velocity of the observer with respect to the medium
vs: velocity of the source with respect to the medium

During the measurement the source (transmitting crystal) and the observer (receiving crystal) are fixed and the fluid is moving. The transmitted signal is only detected if dispersed by moving fluid particles. These particles can be solids or small gas pockets. The Doppler technique only works in liquids that contain enough solids or gas pockets.


The Doppler frequency shift is:
For the Doppler flow measurements, continuous ultrasonic waves can be used. Figure below shows a flowmeter with a transmitter–receiver assembly positioned inside the flowing stream. Here angles are zero. That differential is defined as
Installation requirement:

In general acoustic flow meters need no special requirements regarding installation on or in the process pipe:
-        A vibration-free location is recommended especially when applying the Doppler type flowmeter, as vibrations cause false signals which may fool the electronics.
-          Similar to most flow meters, the measuring pipe must be completely filled with the fluid.
-          A well-developed flow profile is absolutely required for a reliable and accurate measurement. That is why equalization pipes 10 D in front of and 5 D behind the meter are recommended to obtain the given level of accuracy (2%).
-          Pilot valves closely behind the flow meter negatively influence the measurement, especially when cavitation or supersonic velocities occur.

Characteristics:

        No pressure loss in the pipe.
        It is possible to measure without making contact with the fluid (“clamp-on”).
        Only useful for liquids that are acoustically transparent.
        A small, but not excessive amount of contamination of the liquid is necessary for the Doppler effect. The time-of-flight principle needs as little pollution as possible.
        Difficult for small diameters, especially when using the time-of-flight principle.
        For the time-of-flight difference meter the turndown can amount to 1:1,000 and an accuracy level from 1% to 2.5% is possible. For the Doppler type meter the turndown can amount to 1:3,000 with an accuracy level from 2% to 5%.
        Individual calibration is needed for every medium.
        Using the Doppler effect, the reading depends on the flow profile.
        Accuracy levels up to 1% are possible (not when using clamp-on realizations).
        At present it is also possible to ultrasonically measure the flow of gases, steam and even high-temperature steam.

Questions
GATE 2014
A transit time ultrasonic flowmeter uses a pair of ultrasonic transducers placed at 45° angle, as shown in the figure.
The inner diameter of the pipe is 0.5 m. The differential transit time is directly measured using a clock of frequency 5 MHz. The velocity of the fluid is small compared to the velocity of sound in the static fluid, which is 1500 m/s and the size of the crystals is negligible compared to the diameter of the pipe. The minimum change in fluid velocity (m/s) that can be measured using this system is_________.

GATE 2018
T he average velocity v of flow of clear water in a 100 cm (inner) diameter tube is measured
using the ultrasonic flow meter as shown in the figure. The angle ø is 45 degree. The measured
transit times are t1 = 0.9950 ms and t2 = 1.0000 ms. The velocity v (in m/s) in the pipe is (up

to one decimal place) ___.

Saturday, February 15, 2020

Electromagnetic Flowmeter


The electromagnetic flow sensors are useful for measuring the movement of conductive liquids. They are true noninvasive measurements. The operating principle is based on Faraday’s Law of electromagnetic induction.

“If a conductor of length L (m) is moving with a velocity v (m/s), perpendicular to
a magnetic field of flux density B (Tesla), then the induced voltage e across the ends of conductor can be expressed as:

e = BLv

The magnetic field, the direction of the movement of the conductor, and the induced emf are all
perpendicular to each other.”

In the case of electromagnetic flowmeters, the conductor is the liquid flowing through the pipe, and the length of the conductor is the distance between the two electrodes, which is equal to the tube diameter. The velocity of the conductor is proportional to the mean flow velocity of the liquid.

The generated voltage does not depend on parameters such as pressure, temperature, viscosity, conductivity, etc. Only a minimal level of conductivity is required to give this signal a (very small) minimal power.
The accuracy of these meters can be as low as 0.25% and, in most applications, an accuracy of 1% is used.
The traditional magnetic flow meter consists of two units: the measuring probe and electronic converter-amplifier that transforms this mV signal into one or more standard analog or digital signals.

The electrodes are placed at positions where maximum potential differences occur. The electrodes are electrically isolated from the pipe walls by nonconductive liners to prevent short-circuiting of electrode signals. The liner also serves as protection to the flow tube to eliminate galvanic action and possible corrosion due to metal contacts.
The main body of a flowmeter and electrodes can be manufactured from stainless steel, tantalum, titanium, and various other alloys.
The measuring probe consists of two electrodes made of a non-magnetic material
and is positioned at the inside covered with an electric insulating layer. Commonly used insulating layer are Natural rubber or neoprene, PTFE (Teflon), PFA (Per Fluor Alkoxy), Ceramic.

Coil excitation
The magnet coils generate a magnetic field that depends on the form of the field
excitation signal. There are several types of flow meters coil excitation.
(a)    DC excitation: It is only applicable with liquid metals. DC excitation results in electrolysis and hence they are hardly ever used.
(b)   AC or Sinusoidal excitation: An alternating current of 50 Hz to 60 Hz in coils creates
the magnetic field to excite the liquid flowing within the pipe. The disadvantage of these applications is that the electronic noise causes the zero point to drift after a certain time. It is essential to manually readjust the zero point at regular time intervals.
(c)    Pulsed DC field: here the converter feeds the magnetic coils with a pulsed DC (low frequency square wave) current. Because the converter is provided with the necessary intelligence, it can independently control the zero point, so that the zero point is stable. This method has lower power consumption (5-25W).
(d)   Capacitive detection: Here the electrodes, which are in contact with the medium are replaced by capacitive plates and that function as the electrodes of a capacitor. For this model the minimum required conductivity is 100 times lower than for the model with the contact electrodes.

The installation of the flow sensor may occur in every position, as long as the measuring instrument is completely filled with the fluid. If the fluid contains solid particles or fats, the magnetic flow meter is best positioned vertically. When placing it horizontally, the heavier particles will precipitate and the lighter particles will come up.

Theoretically the direction of the flow is not important, as long as the correct electric connection is used.
At a low rate of flow (< 1 m/s) the desired accuracy cannot be obtained. The velocity can be increased by reducing the pipe.

The flow profile is not very important for the magnetic flow meter. In practice,
however, a straight pipe segment of 5 times the pipe’s diameter is recommended. The grounding is of vital importance. This is very important because the voltage on the electrodes amounts to only a few mV.
The pipes of electromagnetic flowmeters must be full of liquid at all times for accurate measurement. If the liquid does not make full contact with electrodes, the high impedance prevents the current flow; hence, measurements cannot be taken. Also, if the pipe is not full, even if contact is maintained between the liquid and electrodes, the empty portions of the pipe will lead to miscalculated flow rates.


Important features

·         Completely obstruction-free and hence no pressure loss.
·         Highly accurate, better than 1% FS for higher flow.
·         Wide span, good linearity.
·         Measuring principle not dependent on pressure, temperature or viscosity.
·         Expensive because of electronics.
·         Minimum conductivity required (5µS/cm).
·         Not dependent on the flow profile
·         No mechanically moving components, maintenance-free.
·         Ideal for contaminated liquids.


Turbine Flowmeter


This flow meter is named so as it measures flow by counting the rotation of a turbine that is positioned in the flow line. The fluid flowing through the pipe makes the blades of turbine rotate at a speed that is proportional to the flow velocity of the fluid. The number of revolutions is monitored by either a gear train or by a magnetic or optical pick-up.
The reader or a “pick-up” is installed perpendicular to the rotor. Two types of pick-up assemblies are commonly used: magnetic pick-up and no drag pick-up.

The magnetic pick-up consists of a permanent magnet with a coil wrapped around the magnet. When the turbine blades cut through the magnetic field, an alternating current, the frequency of which is proportional to the flow, is induced in the coil.
The no drag pick-up consists of an oscillator that transmits a high-frequency carrier wave to the coil of the pick-up. The rotation of the turbine modulates the carrier wave depending on the velocity of the rotor. In both cases pulses proportional to the flow are produced.


Every turbine flow meter is characterized by the K-factor, a coefficient that for a specific flow of a particular fluid shows how many pulses per liter are generated by the flow meter.
The K-factor can be calculated from:
K = 60*f/Qv
where
QV à the flow [liter/minute]
f à frequency [pulse/s]
Kà K-factor [pulse/liter].


Ideally, the value of K-factor should be constant i.e. relationship between the meter output and the flow rate should be linear. In reality, however, the driving torque of the fluid on the blade is
balanced by the influence of viscous, frictional and magnetic drag effects.

Since these vary with the flow rate, the shape of the K-factor curve depends on
viscosity, flow rate, bearing design, blade edge sharpness, blade roughness and the nature of
the flow profile at the turbine leading edge. In practice, all these influences have differing
effects on the meter linearity and thus all turbine meters, even from the same manufacturing
batch, should be individually calibrated.

The linear relationship of the K-factor is confined to a flow range of about 10:1 – sometimes
extending up to 20:1.

At low flows, the poor response of the meter is due to turbine rotor bearing friction, the effect of fluid viscosity and magnetic drag on the rotor due to the use of a magnetic pick-up. The humping section of the curve flattens as the viscosity decreases – with resultant increase in accuracy.

Practical installation

-The turbine flow meter requires equalization pipes at upstream and downstream sides of the instrument. The length of the horizontal pipe segment on both sides depends on the flow conditions. As a rule of thumb equalization pipe of 10D upstream and one of 5D downstream is recommended.

– The accuracy of the instrument is strongly influenced by the quality of the blades and the friction of the rotor against its axis.

– Inertia of the rotor can greatly influence the response time, especially when dealing with gases.
– To perform the digital-to-analog conversion, a frequency-to-voltage converter can be used, which transforms the pulses into a standard electrical signal.

– To stop any contamination that might block the turbine, a filter can be placed in front of the turbine flow meter if desired.

– Providing a bypass is efficient for continuous processes as it allows the replacement and cleaning of the flow meter (and of the filter) without interrupting the process.

Characteristics

Advantages

-          An extensive selection of ranges is available, for gases as well as for liquids.

-          A high level of accuracy, (0.2-0.3%), is attainable under specific circumstances because of the digital output.

-          Excellent repeatability (± 0.05 %).

-          Wide rangeability up to 20:1

-          Wide range of temperature applications from -220 to 600 °C

-          Measurement of non-conductive liquids.

-          Suitable for very low flow rates.

Disadvantages

-          Very sensitive to wear, especially with highly contaminated fluids and at high speeds.

-          Linear only in a limited area, which reduces the measuring range.

-          Not suitable for high viscous fluids.

-          Viscosity must be known.

-          10 diameter upstream and 5 diameters downstream of straight pipe is required.

-          Not effective with swirling fluids.

-          Only suitable for clean liquids and gases.

-          Relatively expensive.

Wednesday, February 5, 2020

Voltage references


The ability of a voltage reference or regulator to maintain a constant output under varying external conditions is characterized in terms of performance parameters such as line and load regulation, and the thermal coefficient. In the case of voltage references, output noise and long-term stability are also significant.


Line and Load Regulation
Line regulation, also called input, or supply regulation, gives a measure of the circuit’s ability to maintain the specified output under varying input conditions.


where Vo is the output change resulting from a change ∆Vi at the input. Line regulation is expressed in millivolts or microvolts per volt.


Load regulation gives a measure of the circuit’s ability to maintain the specified output voltage under varying load conditions.

Temperature Coefficient
The temperature coefficient of output voltage gives a measure of the circuit’s ability to maintain the specified output voltage Vo under varying thermal conditions.
It is usually expresses in mV/C.
Besides line and load regulation, thermal stability is the most critical performance requirement of voltage references due to the tendency of IC components to be strongly affected by change in temperature. Consider the silicon pn junction, which forms the basis of diodes and BJTs. Its forward-bias voltage VD and current ID are related as
where VT is the thermal voltage and Is the saturation current.
where k =1.38×10⁻²³ J/K is known as Boltzmann’s constant, q = 1.602 x 10⁻¹⁹ C, T is absolute temperature.

TC = VT/T = k/q = 0.086 mV/C
Temperature coefficient for diode forward voltage drop VD is -2.1 mV/ C.
Two types of voltage references are popular - Zener voltage reference and Bandgap reference.

Zener Voltage Reference

A zener diode is widely used as a voltage reference. While true zener breakdown occurs below 5V, avalanche breakdown occurs at higher voltages and has a positive temperature coefficient. Zener breakdown truly has negative temperature coefficient but nowadays avalanche breakdwon is referred to as zener breakdown only.

A combination of normal PN diode with negative temperature coefficient is used to compensate for temperature instability as shown below.

However to get maximum temperature compensation, odd values of output voltage is produces like 4.7, 5.3, 6.2V etc.

As Zener to avalance transition occur at 5.6 volt (and we use avalanche diode as voltage reference), a input voltage higher than 6.2V (5.6+VD) is required.
                       
  
Bandgap voltage reference

For circuits which are powered by low voltage supply, bandgap reference offers an exciting choice. They can offer much lower voltage output as they utilize PN junction bandgap voltage which is 1.2V for Silicon.

The value of VT is 0.086mV/C and it has positive temperature coefficient. This voltage can be used to compensate temperature related variation of VBE by amplifying the value to +2mV/C.

This is the scheme behind Bandgap reference.

The actual circuit of a bandgap reference may look as below.


Relation between dBm and dBV with 50 Ohm Impedance

Relationship Between dBm and dBV with 50 Ohm Impedance Relationship Between dBm and dBV with 50 Ohm Impedance ...